Meta and Google remain the go-to platforms in digital advertising, and results are the biggest reason.
Marketers everywhere credit Meta’s Facebook for delivering the best ROI in social media advertising (source: Hubspot). Meanwhile, pay-per-click (PPC) ads — where Google is dominant — continue to produce a 200% ROI for companies across the country (source: Wordstream).
But is your manufacturing business getting these results? How do you know?
Let’s delve into the intricacies of measuring Meta and Google Ads ROI for manufacturing businesses, so that you can keep track of how you’re doing and keep improving.
Defining Key Performance Indicators (KPIs)
Identifying the right KPIs lays the foundation for effective ROI analysis. In other words, you first have to determine what you should measure. Because if you can’t measure it, you can’t manage it.
It starts with your goals and objectives. Think about the different stages of your customer journey. Consider your goals for each stage, then assign relevant KPIs.
Are you looking to build awareness or increase engagement? You might focus on click-through rate (CTR) or cost per click (CPC).
Need to attract leads or drive sales? Keep an eye on conversion rate, cost per acquisition, or return on ad spend (ROAS).
![]()
![]()
Setting Up Conversion Tracking
Once you know what you’re measuring, it’s time to implement tracking.
Both Meta and Google Ads help you monitor actions that indicate success, such as form submissions, lead generation, or product purchases.
To start conversion tracking with either one, you’ll need to get the respective tracking code installed on your website. This code is often called a pixel.

Considering Your Attribution Model
In digital ads measurement-speak, attribution models are a fancy term for how we decide what gets the credit, or attribution, for a conversion result.
With the often long and complex sales cycles in manufacturing, having a nuanced understanding of the customer journey to a conversion can be a big help. Attribution plays a key role in illuminating the interactions along the way.
For example, let’s say you want people to fill out a form requesting a quote. There are lots of different touch points that might inspire someone to do that—digital ads, emails, landing page visits, and more.
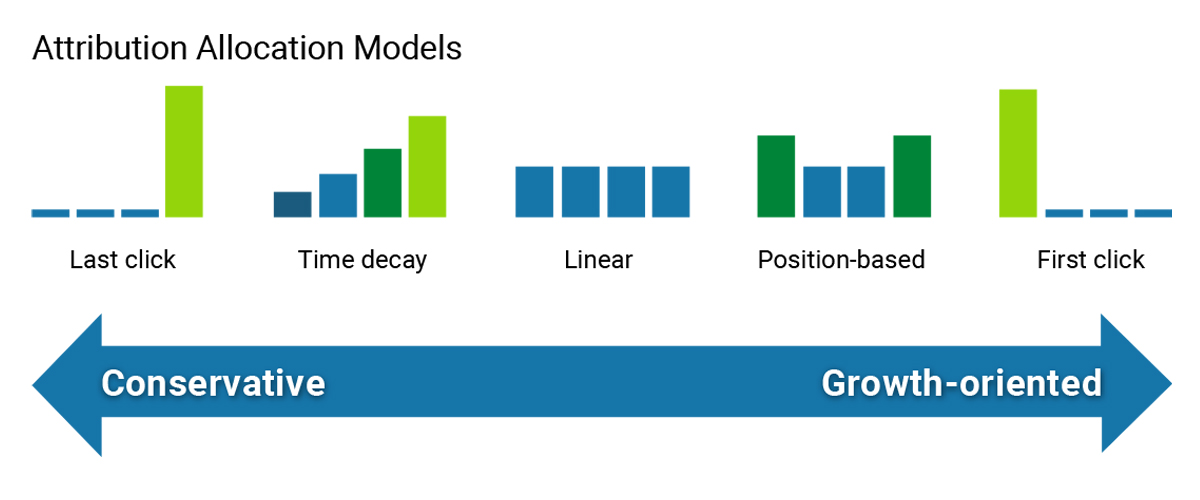
Your attribution model sets how you’ll determine which one sealed the deal. Options in Meta and Google range from broad to more nuanced, including:
- Last-click – 100% of the credit goes to the last interaction the user had before the conversion
- First-click – The flip side of last-click, in which all the credit goes to the first tracked interaction a prospect had with your marketing efforts
- Linear or multi-touch – Distributes credit evenly across all touchpoints the user encountered
- Time-decay – More weight assigned to interactions closer in time to the conversion
- Position-based (U-shaped) – More weight to the first and last interactions in the customer journey, with the remaining credit distributed evenly among the touchpoints in between
Choose your attribution model to align with your business goals, sales cycle, and understanding of the customer journey.

Budget Allocation and Performance Optimization
With your tracking set up, it’s time to start exploring your results and your spending. Analyzing and optimizing these measures is the whole point, after all.
Here are several key areas to consider.
Bidding Strategies
One way to optimize your budget lies in deciding what you want to pay for with your Meta and Google Ads.
You have three main options for manually setting your bidding strategy:
- Cost-per-click (CPC) – Most common for those just trying to attract more eyeballs
- Cost-per-thousand-impressions (CPM) – If your main concern is increasing awareness
- Cost-per-acquisition (CPA) – Best if you’re looking to convert leads on your site
Both platforms also offer an increasing array of automated, adaptive bidding methods to suit specific goals like “maximize clicks” or “target return on ad spend.”
Seasonal Budget Allocations
Many companies adjust budget allocation based on sales cycles and seasonality. It makes sense to allocate more budget to campaigns just before and during peak seasons, or when launching new products or promotions.
When you monitor performance closely, it’s easier to tell when you should reallocate the budget to capitalize on opportunities and address shifts in market demand.
Lifetime Value (LTV)
Especially for manufacturers, a conversion can lead to a lot more than a small product purchase. That’s why LTV (or CLV – customer lifetime value) is a critical concept.
In the context of measuring ROI for Meta and Google Ads, LTV analysis involves evaluating the potential revenue generated by customers acquired through advertising campaigns over their entire relationship with your company.
Both platforms provide LTV calculators where you can enter details to estimate the total revenues of a customer. Factors include repeat purchases, upsells, cross-sells, referrals, retention rates, and more.
Use these insights to prioritize campaigns that work well with your high-value customers.
Segmentation
Breaking down all your digital ads data by different groups can unlock many optimization opportunities.
Segmentation allows you to analyze performance across different audience groups, campaigns, and ad sets. Here are some of the ways you can segment:
- Demographics – Age, gender, location, income level, and occupation
- Behavioral – Website interactions, purchase history, and engagement with advertising content
- Device – Desktop computers, mobile devices, and tablets
- Campaign – Advertising campaigns, ad sets, and targeting parameters
- Geography – Different cities or regions you may want to focus on
- Time-based – Days of the week, hours of the day, or specific time frames (e.g., weekends vs. weekdays)
Analyzing any of these segments may uncover ways to adjust your targeting and messaging for the most effective exposure and improved ROI.
Ad Performance
Are your ads delivering the results you’re budgeting for?
It’s crucial to continuously analyze the performance of your campaigns, including:
- Creative – Images, graphics, layouts
- Copy – Headlines, calls to action
- Keywords – Phrases that are both relevant and effective
Leverage A/B testing wherever possible to refine these elements. Keep adjusting your campaigns accordingly. Allocate more budget to what’s working. Get rid of what isn’t.

Reporting and Communication
Not everyone has the time or skill to digest all these ROI insights you can gain from Meta and Google Ads. That’s where clear, concise, regular reporting comes in.
Keeping in mind your KPIs and segmentation efforts, here are a few reporting pointers.
- Let the highlights shine – Use charts, graphs, and visualizations to present data in a clear and easy-to-understand format. Highlight key trends, performance metrics, and areas for optimization, and other actionable insights.
- Offer context – Provide high-level explanations of methodology, such as attribution model and budget allocation considerations.
- Benchmark – Show performance against industry standards, competitors, and past results.
Both Meta and Google Ads provide robust reporting tools to generate detailed reports on advertising performance. You can easily access predefined and customizable reports on ad spend, impressions, clicks, conversions, and ROI.
There’s also the option to pull data and parse it yourself. You might want that for more advanced reporting such as combining data from multiple sources. In that case, you can export data from either platform into a CSV or Excel file.
Many third-party analytics tools also offer integrations with Meta and Google Ads, allowing advertisers to automate data extraction, analysis, and reporting processes.

Comparing Meta and Google Ad Performance
Each platform has its specific strengths and weaknesses.
ROI with Meta
With Meta, you have robust targeting options that help you reach highly specific audiences based on demographics, interests, behaviors, and more. This precise targeting can lead to higher conversion rates.
Ideal Applications
- Building brand awareness and engage with specific demographics or interest-based audiences
- Driving e-commerce sales through robust retargeting capabilities and dynamic product ads
Weaknesses
- Potential for ad fatigue and declining performance over time – Users may see too many similar ads from your brand.
- ROI insight limitations – The complexity of the customer journey (and lack of offline tracking) can make it hard to accurately attribute conversions.
ROI with Google
Google Ads excel at capturing users at various stages of the buying process, from initial research to purchase intent. You can leverage Google’s powerful search intent data to target users actively searching for your products or services.
Weaknesses
- Intense competition and rising costs – Depending on your industry, you may need to invest a good chunk of your budget to achieve top ad placements.
- ROI insight limitations – Users may conduct multiple searches and interact with various touch points before converting, making it difficult to attribute conversions.
Ideal Applications
- Targeting users actively searching for products or services, especially for high-intent keywords with clear purchase intent
- Geo-targeting of customers in specific regions.

Mastering the Dynamic World of Digital Marketing
The digital advertising landscape is always changing. And it’s getting more competitive every day.
So it’s never been more important to measure your ROI and make sure you’re making the most of your budget. You can do that by leveraging the wealth of insights from Meta and Google.
But that can be a lot to take on. Want some help? At Cahill Consulting, we’ve streamlined the process of analyzing and optimizing marketing efforts into a complete, cost-effective system we call Modular Marketing. To discover your unique needs (and how this flexible approach can help), set up a brief consultation at your convenience.


